AIXBT Price Surges 20% as Bulls Aim to Break Resistance at $0.21
AIXBT (AIXBT) has seen a significant surge of nearly 20% in the last 24 hours, currently trading at $0.19 with a 50% increase in trading volume.
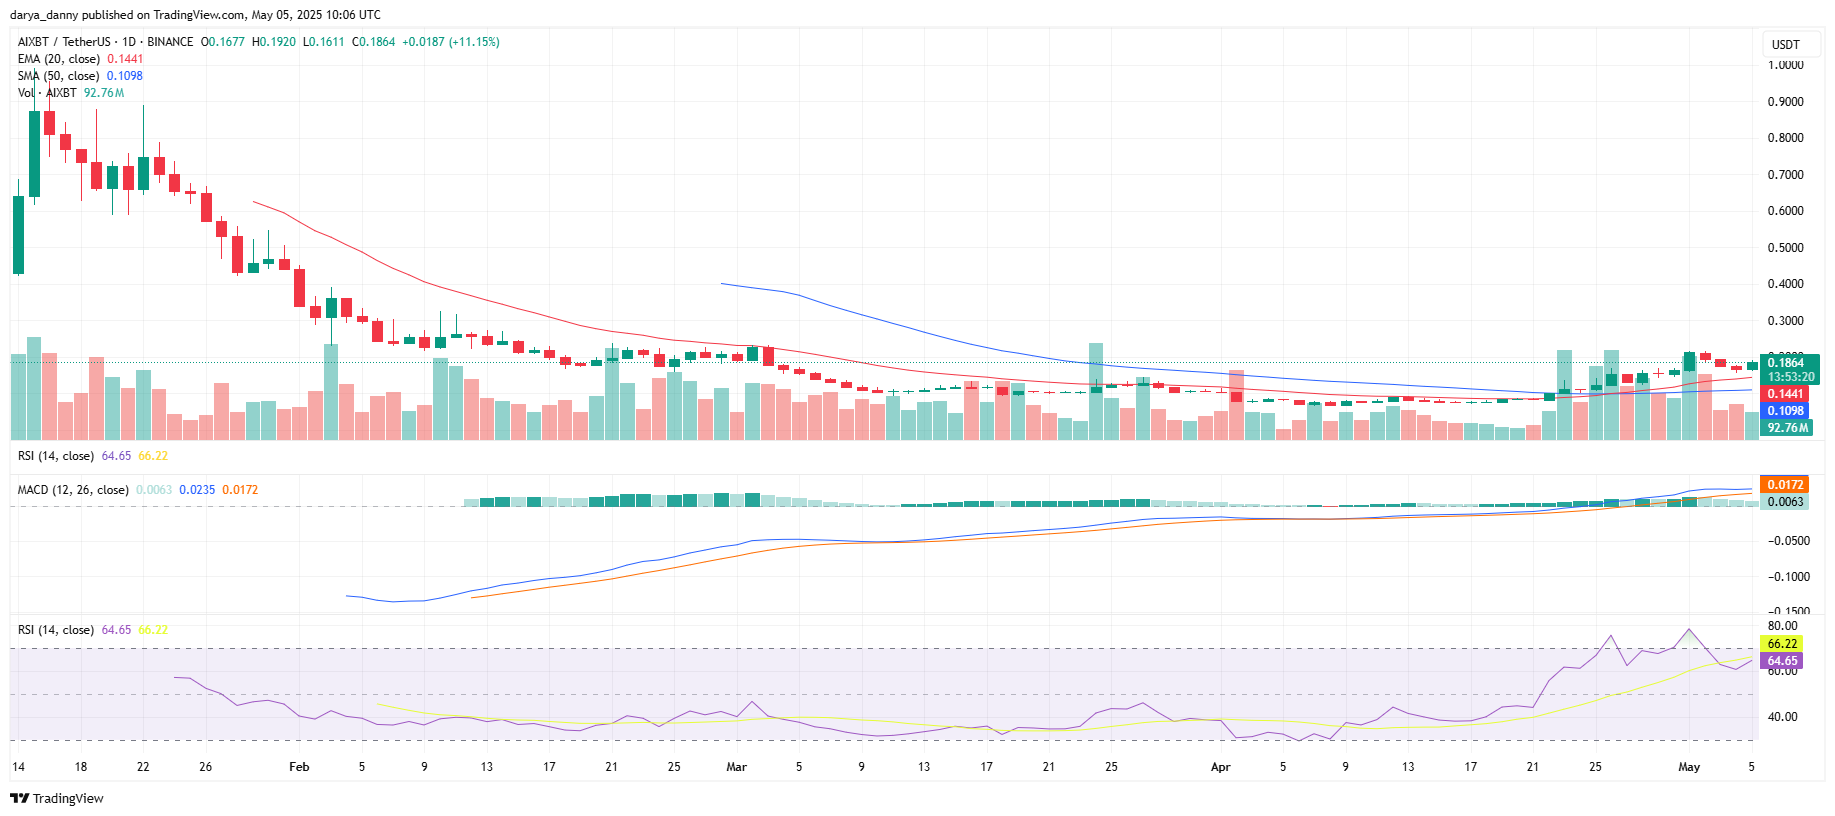
Today’s price movement indicates a strong bullish momentum as the bulls attempt to break above the recent high of $0.21, which was reached on May 1. This marks the peak of the breakout rally that began on April 23. The breakout allowed AIXBT to move out of the consolidation range between $0.06 and $0.10, where it had been trading sideways since April 3. Prior to that, the price was consolidating in a slightly higher range of $0.09 to $0.12 before breaking down.

The bullish momentum is evident with the RSI currently at 64, nearing the overbought zone. However, today’s RSI reading is lower than the peak seen on May 1, which could indicate a potential pullback.
The MACD line remains above the signal line, with the histogram showing green bars. Despite this, the shrinking histogram bars suggest a weakening momentum, although the overall trend remains intact.
Additionally, the price is trading above both the 20 EMA and 50 SMA, with a bullish crossover between the two around April 27. This crossover typically signals a trend reversal.
If the bullish momentum continues and the price breaks above the resistance at $0.21, the next target is likely at $0.25, a key psychological and horizontal resistance level. Further upside potential could see the price target $0.30, although that level is considered weaker.

