

After experiencing a significant drop on Monday, Ethereum (ETH) dipped below key support levels and reached its lowest price since November. Despite this downward trend, many experts in the market maintain a bullish outlook, predicting a substantial rally for the cryptocurrency in the current quarter.
Related Reading
Ethereum’s Price Plummets to Two-Month Lows
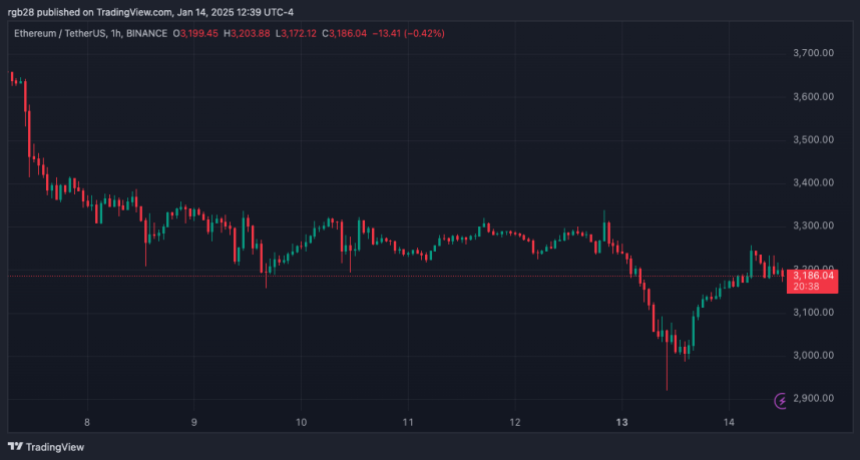
The week started off with Ethereum undergoing a notable correction, plummeting from its weekend range to hit its lowest price in two months. Over the weekend, Ethereum’s price fluctuated between $3,200 and $3,340 after recovering from the lows of the previous week.
Crypto analyst Ali Martinez highlighted that ETH faced crucial resistance between the $3,360 and $3,450 range, where 4.37 million addresses collectively held 6.47 million ETH. Additionally, Martinez pointed out that the cryptocurrency’s main support level was situated between $3,066 and $3,160, with 4.12 million addresses holding 4.9 million ETH in that range.
During the December corrections, Ethereum had tested this support zone and rebounded from it following pullbacks. However, for the first time since November 9, the leading Altcoin dropped below this critical support level, hitting a low of $2,920 on Monday.
Following a 12% retracement from the weekend highs, ETH tested its post-election breakout level and confirmed the $2,900 price range as a support level. Subsequently, Ethereum swiftly bounced back from this level, surging by 9% to reach the $3,100-$3,200 range.
Crypto investor Miky Bull sees ETH’s recent performance as the “perfect setup for a significant reversal.” Bull noted that this could potentially lead to a breakout from Ethereum’s inverse head and shoulders pattern.
Several analysts have observed that the second-largest cryptocurrency by market capitalization has been forming a multi-month inverse head and shoulder pattern, with the left shoulder forming around the $2,800 price level.
Rekt Capital had previously suggested that “any pullback close to the $3,000 level could see Ethereum develop a right shoulder.” Meanwhile, Miky Bull stated that the bullish setup was targeting the $7,000 mark.
Similar Trajectory to 2021
Analyst Crypto Bullet pointed out that ETH’s current chart pattern resembled its behavior in 2021. The chart indicated that Ethereum had experienced a Double Top pattern during its rally over three years ago. Following this, the cryptocurrency dropped below the crucial support zone of $3,100, confirming the pattern.

However, Ethereum reclaimed this level after a two-week consolidation period, leading to the breakout to its all-time high (ATH). As per the analyst, Ethereum seems to be replicating this pattern following the recent drop, suggesting that the “worst-case scenario” for the cryptocurrency would be reaching ATH levels once again.
Daan Crypto Traders highlighted ETH’s historical performance at the beginning of the year, stating that “the percentages ETH achieves within the first few weeks of the year are quite remarkable.”
Related Reading
Data from CoinGlass indicates that Ethereum mostly recorded negative weekly returns in the initial weeks of 2024 but commenced a 6-week positive streak as February approached. This trend could suggest that ETH’s negative performance might be reversed in the upcoming weeks. Nonetheless, Daan recommended that investors review the quarterly returns for a more comprehensive view of seasonality.
At the time of writing, ETH is trading at $3,230, reflecting a 3% increase in the daily timeframe.
Featured Image from Unsplash.com, Chart from TradingView.com