

Ethereum Price Faces Resistance and Dips Below $4,600
Ethereum encountered resistance near the $4,600 level and started a downward correction. The price is currently trading below $4,550 and the 100-hourly Simple Moving Average, indicating a bearish trend in the short term.
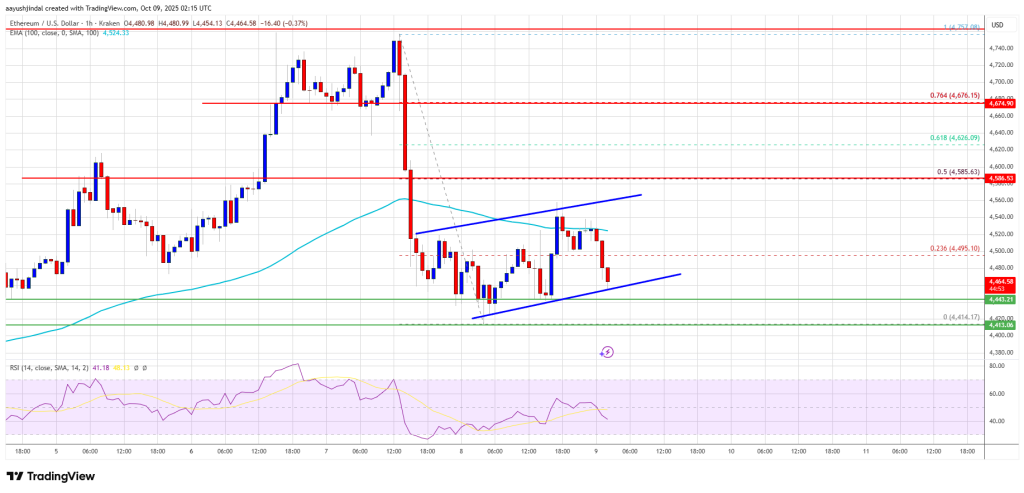
A short-term rising channel has formed with support at $4,460 on the hourly chart of ETH/USD, suggesting that the pair could continue to move lower if it breaks below $4,400.
Ethereum Price Dips After Testing $4,750 Resistance
After testing the $4,750 resistance zone, Ethereum price declined and formed a low at $4,414. The price is now consolidating losses, with a minor recovery above $4,500. However, the bears are active near the $4,550 level, with a short-term rising channel providing support at $4,460.
Currently trading below $4,520 and the 100-hourly Simple Moving Average, Ethereum faces resistance near $4,520 and $4,550. The next key resistance is around $4,585, followed by the $4,620 level, which could lead to further gains in the near term.
Potential for Further Losses in ETH
If Ethereum fails to clear the $4,550 resistance, it could initiate a fresh decline. Initial support is at $4,460, followed by a major support level near $4,420. A break below $4,420 could lead to a test of the $4,320 support, with further losses potentially pushing the price towards $4,250 and $4,150.
Technical Indicators:
Hourly MACD – The MACD for ETH/USD is showing bearish momentum.
Hourly RSI – The RSI for ETH/USD is below the 50 zone, indicating a bearish trend.
Major Support Level: $4,420
Major Resistance Level: $4,550