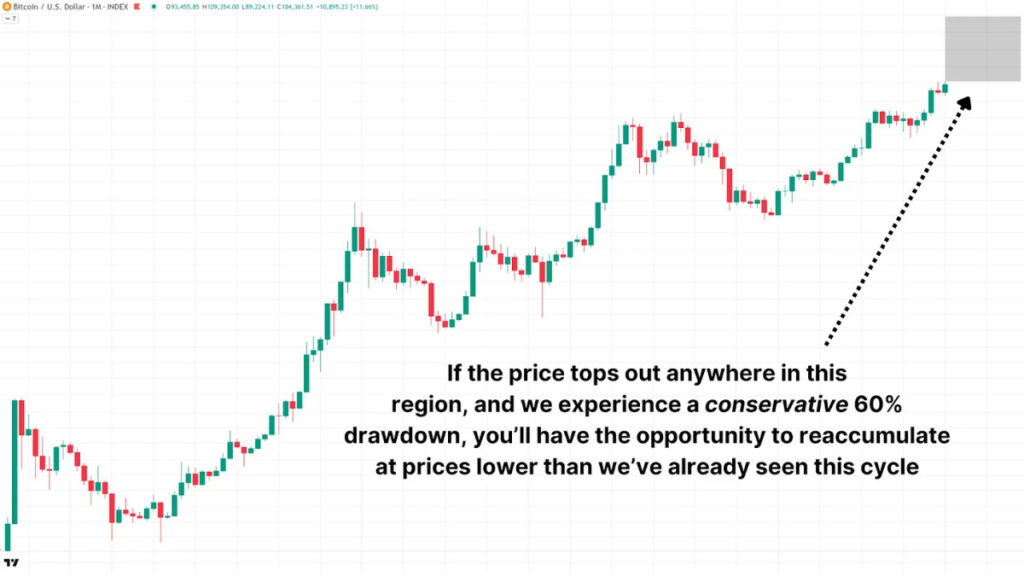
Selling Bitcoin is a controversial topic, but for many investors looking to take profits during this cycle, strategic planning is essential. While some choose to hold Bitcoin indefinitely, others aim to capture gains, cover expenses, or reinvest at lower prices. Historical trends indicate that Bitcoin often experiences significant drawdowns of 70-80%, providing opportunities to reaccumulate at reduced valuations.
For a deeper dive into this subject, you can watch a recent YouTube video titled “Proven Strategy To Sell The Bitcoin Price Peak.”
Why Selling Isn’t Always Taboo
While individuals like Michael Saylor advocate for never selling Bitcoin, this approach may not be suitable for all investors. Taking partial profits can offer flexibility and peace of mind. For instance, if Bitcoin reaches $250,000 and experiences a 60% correction, dropping to $100,000, it presents a chance to reenter the market at lower levels than previously seen.
The goal is not to sell everything at once but to strategically scale out of positions, maximizing returns and managing risks. Making data-driven decisions rather than emotional reactions is crucial. Ultimately, the decision to sell or hold should align with your personal financial goals.
Key Timing Tools
Several key timing tools can help investors make informed decisions about when to sell Bitcoin. The Active Address Sentiment Indicator (AASI) tracks changes in network activity compared to Bitcoin’s price movement. It measures deviations between price and network activity, highlighting potential sell signals when certain thresholds are breached.
Another valuable tool is the Fear and Greed Index, which quantifies market sentiment ranging from extreme fear to extreme greed. High readings often precede market corrections, providing valuable insights for investors looking to sell at opportune times.
The Short-Term Holder MVRV is another indicator that measures the average unrealized profit or loss of new market participants. Reversals and potential peaks can be identified based on profit levels and market overheating.
The Bitcoin Funding Rates reflect the premiums traders pay to maintain leverage positions in futures markets. Extremely high funding rates may indicate excessive bullishness, signaling a potential market correction.
The Crosby Ratio is a momentum-based indicator that highlights overheated market conditions. When the ratio enters the red zone on the daily chart, it often precedes market turning points.
Conclusion
Timing the exact top of the Bitcoin market is challenging, and no single metric or strategy guarantees success. By combining multiple indicators for confluence and scaling out of positions incrementally, investors can make more informed decisions about when to sell. Consider setting trailing stops tied to key levels or percentage movements to capture additional gains if the price continues to rise.
For advanced Bitcoin analysis, live charts, indicator alerts, and industry reports, consider subscribing to Bitcoin Magazine Pro. Remember, this article is for informational purposes only and should not be considered financial advice. Always conduct your own research before making investment decisions.

