


PEPE Price Analysis: Is a Rally on the Horizon?
PEPE, known for its volatility, is currently at a crucial point in its price movement. After reaching a peak of $0.000028 towards the end of 2024, the token has been experiencing a corrective phase, now trading around $0.00001. Technical indicators suggest a shift in momentum, with the RSI dropping below neutral levels and the MACD showing bearish divergence. As whale activity and profit-taking impact price action, the future trajectory of the PEPE price rally remains uncertain.
Key Resistance Levels
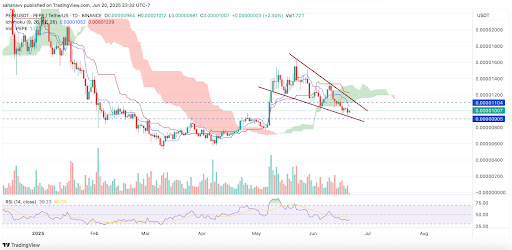
On the daily chart, PEPE has struggled to maintain momentum after facing repeated rejections near the $0.000012 resistance level. This resistance zone has acted as a short-term barrier, with each attempt to rally being met with selling pressure. Despite this, the token continues to hold a bullish pattern, indicating a possible upward movement. However, breaking above the $0.000011 level is crucial to negate bearish pressures.
Technical Indicators
The PEPE price chart shows a clear falling wedge pattern, with multiple bounces off support and resistance levels. The price is currently near the wedge apex, just above a key support zone below $0.00001. A breakout to the upside could propel the price towards the $0.0000135 to $0.000014 resistance zone, where previous liquidity was concentrated. While the RSI indicates a bullish divergence, the Ichimoku cloud presents some concerns.
The conversion line is in a steep descent with the cloud turning bearish, signaling continued selling pressure. Additionally, the MACD has turned bearish with a declining histogram, indicating weakening bullish momentum. A break below support could test the $0.000095 level, while a bullish continuation could see the price reclaim $0.0000115 to $0.000012.