IX Swap Token Price Surges to New Heights
IX Swap token price has experienced a remarkable surge over the past four days, reaching its highest level since March 4.
The price of IX Swap (IXS) has soared to $0.2692, marking a staggering 155% increase from its low in April.
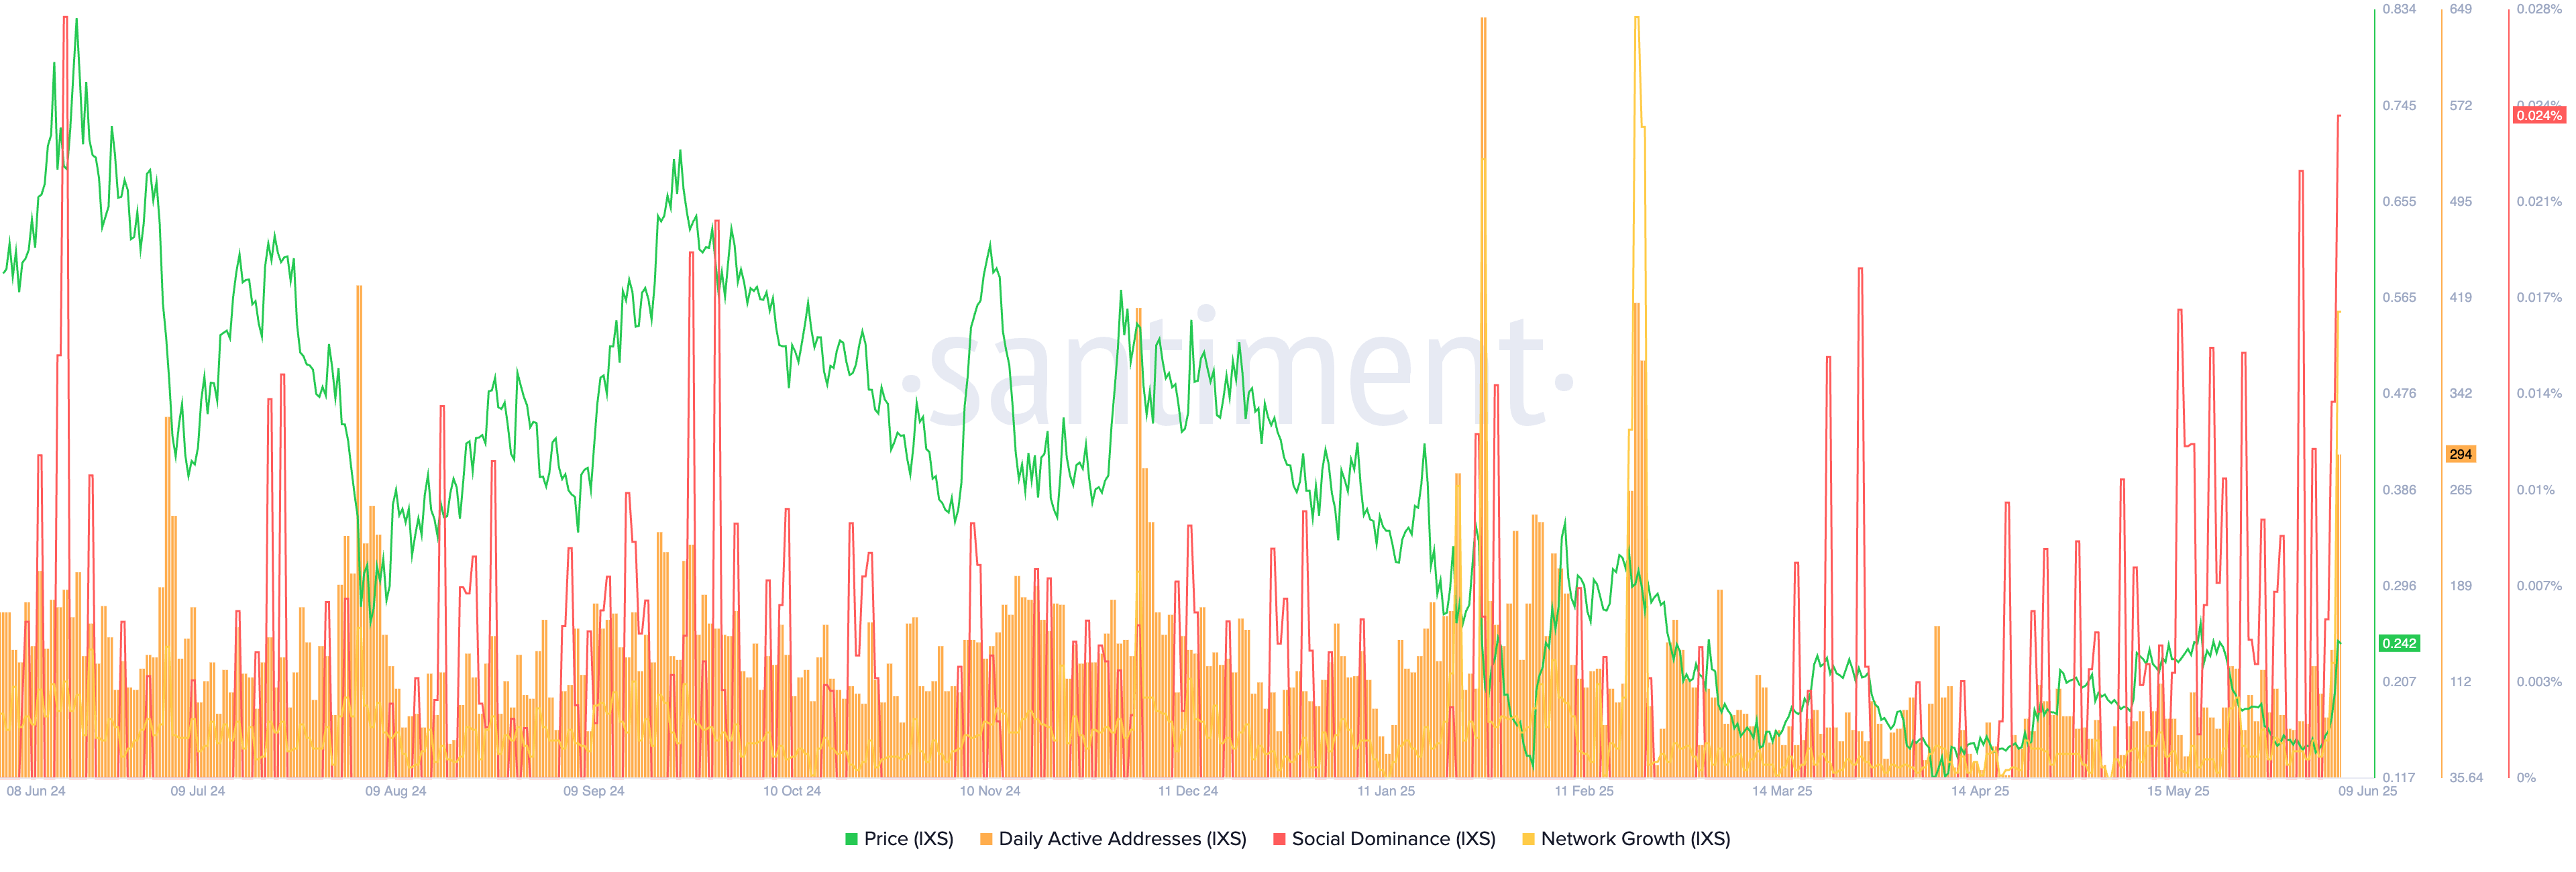
This surge in price coincides with a significant rise in on-chain activity, with the number of active addresses reaching 300, the highest since February. The spike in engagement is likely driven by increased retail participation fueled by the fear of missing out.
Notably, the social dominance of IXS has reached 0.024%, the highest point since June of last year. Additionally, network growth has surged to 176, a significant increase from last week’s low of 12.

Despite the significant price surge, there has been no specific news catalyst behind the movement of IXS. This could potentially indicate a pump-and-dump pattern, which is common among low-cap, thinly traded tokens.
IXS currently boasts a market capitalization of $42 million, with the majority of its trading volume concentrated on Uniswap (UNI). Notably, the token is not listed on major tier-1 exchanges such as Binance, Coinbase, or Upbit.
One potential factor contributing to the price surge could be anticipation of a major announcement, such as a new partnership or exchange listing. It is not uncommon for crypto tokens to rally in anticipation of such news.
From a fundamental standpoint, the IXS ecosystem remains relatively weak, with a total value locked (TVL) in the network amounting to just $449,844.
The platform of IXS enables Bitcoin (BTC) holders to generate yields ranging from 4% to 10% without the need to sell their assets. Users can pledge BTC as collateral, receive USDT in return, and deploy it into regulated, fixed-income real-world assets.
Technical Analysis of IXS Crypto Price

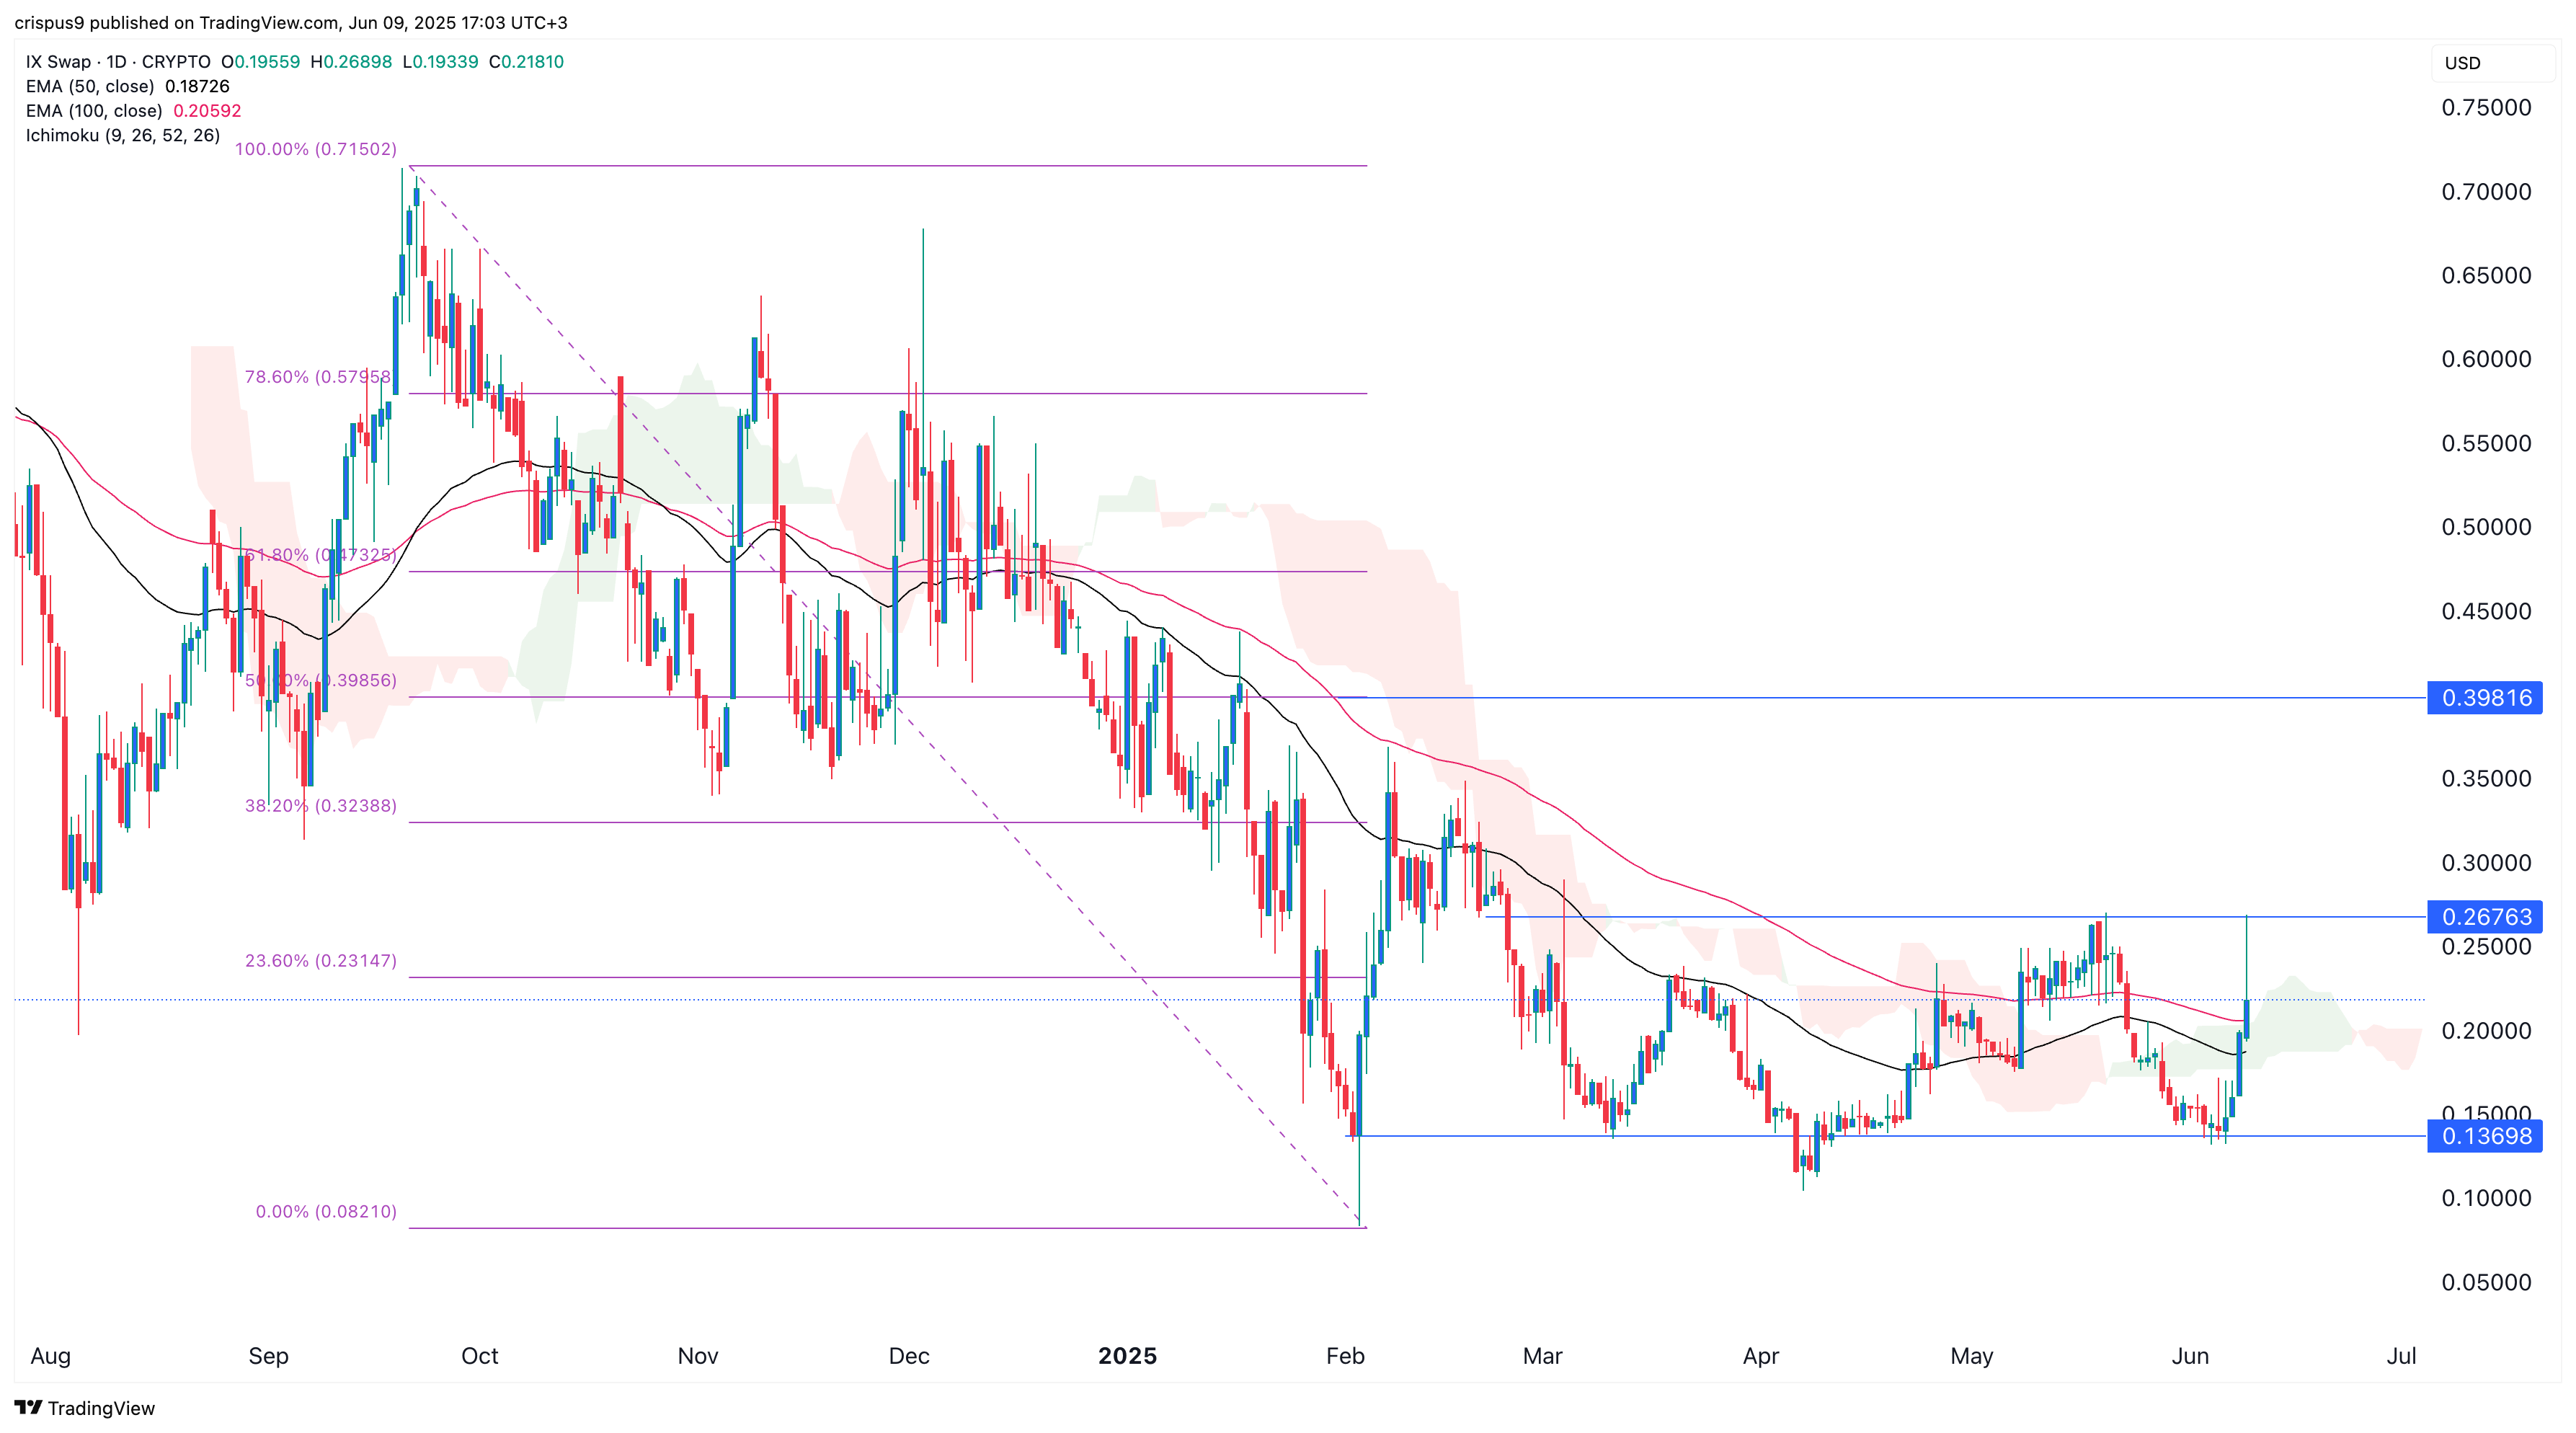
Looking at the daily chart, IXS hit a low of $0.1370 last week before surging to $0.2676 on Monday, reaching its highest level since March. The token briefly traded above the 50-day and 100-day Exponential Moving Averages, as well as the Ichimoku cloud indicator.
Given the rapid price movement, a short-term pullback is likely as traders start to take profits. In case of a pullback, the price could retreat towards the lower boundary of the channel around $0.1398. On the other hand, a breakout above the upper boundary of the channel at $0.2676 could pave the way for further gains, with the next resistance level at the 50% Fibonacci retracement level of $0.3980.

