
XRP Price Analysis: Market Volatility Continues as XRP Tests Key Support Levels
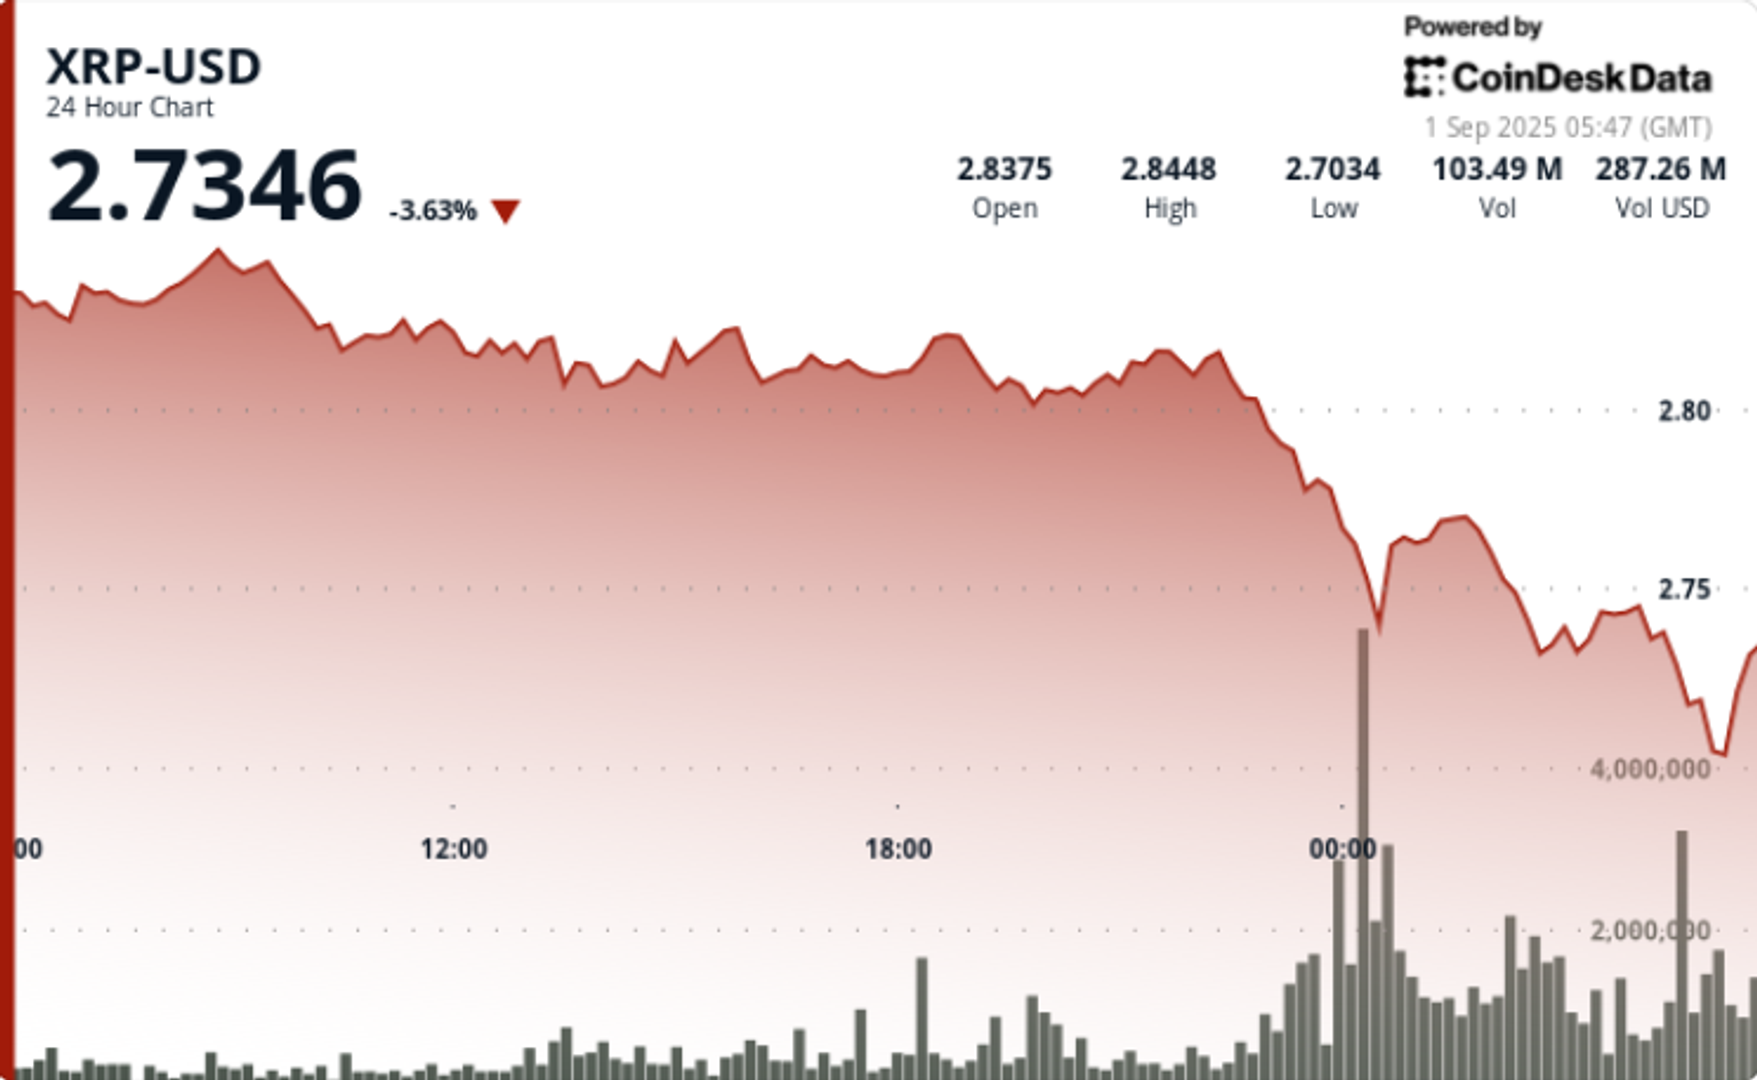
XRP experienced a 4% decline in the 24-hour session ending on September 1st, moving from $2.85 to $2.75. The cryptocurrency traversed a $0.12 range, reflecting market volatility. Institutional liquidation flows totaling $1.9 billion since July have added to the turbulence, raising concerns of cyclical exhaustion.
Despite the institutional selling pressure, whales have been accumulating XRP, with a total of 340 million tokens acquired over the past two weeks. This contradictory behavior between large holders and short-term liquidators has added an interesting dynamic to the market.
As we enter September, historical data suggests caution as crypto markets have typically underperformed during this month. Additionally, ongoing regulatory pressure in the U.S., particularly the unresolved SEC actions, has kept institutions on edge.
On-chain data reveals increased activity on the XRP Ledger, with formations resembling pre-breakout conditions from 2017. Liquidity maps indicate concentrations up to $4.00, potentially amplifying any upward movement.
Price Action Breakdown
The most significant decline occurred at 23:00 GMT on August 31st, with XRP dropping from $2.80 to $2.77 on a volume of 76.87 million tokens, nearly triple the daily average. Support levels were tested again towards the end of the session, confirming forced liquidations.
Earlier in the day, XRP briefly touched $2.87 before retracting, indicating that institutional selling has been capping rallies above $2.80.
Technical Analysis Overview
- Support Levels: Immediate support lies at $2.75–$2.77, with critical longer-term levels at $2.50 and $2.00.
- Resistance Levels: Heavy rejection is seen at $2.80–$2.87, with a breakout line at $3.30 for higher-term momentum.
- Momentum Indicators: RSI suggests oversold conditions, while MACD shows potential for a crossover if accumulation continues.
- Chart Patterns: Symmetrical triangle and double-bottom formations align with a long-term cup-and-handle structure, indicating upside potential to $5–$13 if resistance is breached.
- Volume Analysis: Spike in volume during the $2.80 breakdown confirms distribution, but whale accumulation supports the case for overall accumulation.
Market Outlook and Key Considerations
- Will $2.75 hold as the new support level going into early September?
- A close above $2.87 could signal a move towards $3.30.
- Monitoring the divergence between institutional selling and whale accumulation as a market driver.
- How seasonal September weakness may impact the bullish structural setups pointing to higher price targets.