

Cardano (ADA) Surges Past $1 Mark, Showing Strength in Market
In a remarkable display of strength in an otherwise quiet market, Cardano (ADA) has broken above the $1 mark on January 3. With a surge of over 11% in the past 24 hours, ADA has outperformed other top cryptocurrencies like Bitcoin, which have mostly shown flat performances.
Among the top 100 assets by market capitalization, only Murad-memecoin SPX6900 (SPX) has seen a higher 24-hour gain, rising by 30%. Over the last week, ADA has increased by approximately 20%.
While there doesn’t seem to be a specific catalyst for this jump, Cardano’s roadmap includes several significant protocol enhancements in the upcoming months. These include the development of a Bitcoin-centric decentralized financial ecosystem and ongoing efforts to enhance Cardano’s scalability, decentralization, and interoperability with other networks.
Broader Optimism and Technical Factors Drive Price Action
These fundamental developments suggest that the current price action may be driven by broader optimism about the network’s future, although technical factors seem to be the primary driver. Crypto analyst Satoshi Stacker (@StackerSatoshi) noted, “ADA pushing through resistance like its butter. This momentum is truly explosive. Pay attention to key resistance levels, this one wants to go higher.”
Cardano Price Analysis
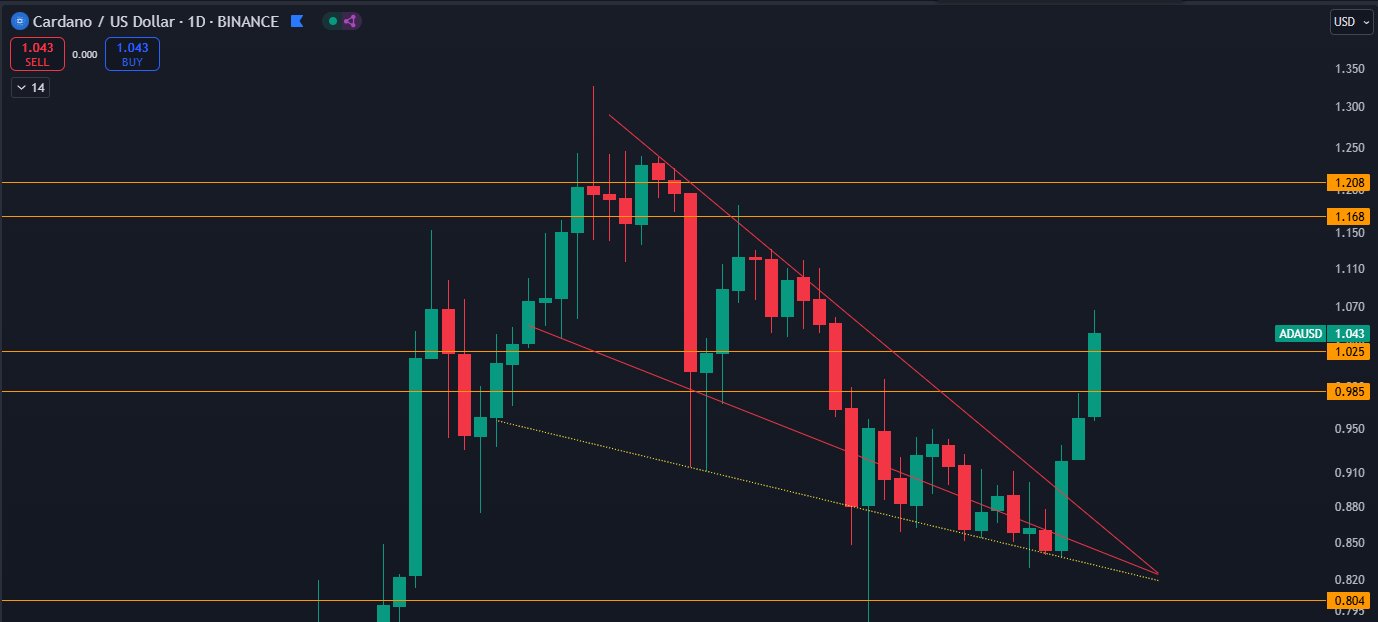
On January 1, ADA/USDT broke out of a multi-week downward trendline that started near $1.32 on December 2. After multiple tests, the trendline was finally breached with strong bullish momentum. Following the breakout, ADA retraced to around $0.87 before bouncing back in a retest that confirmed the trendline breach.
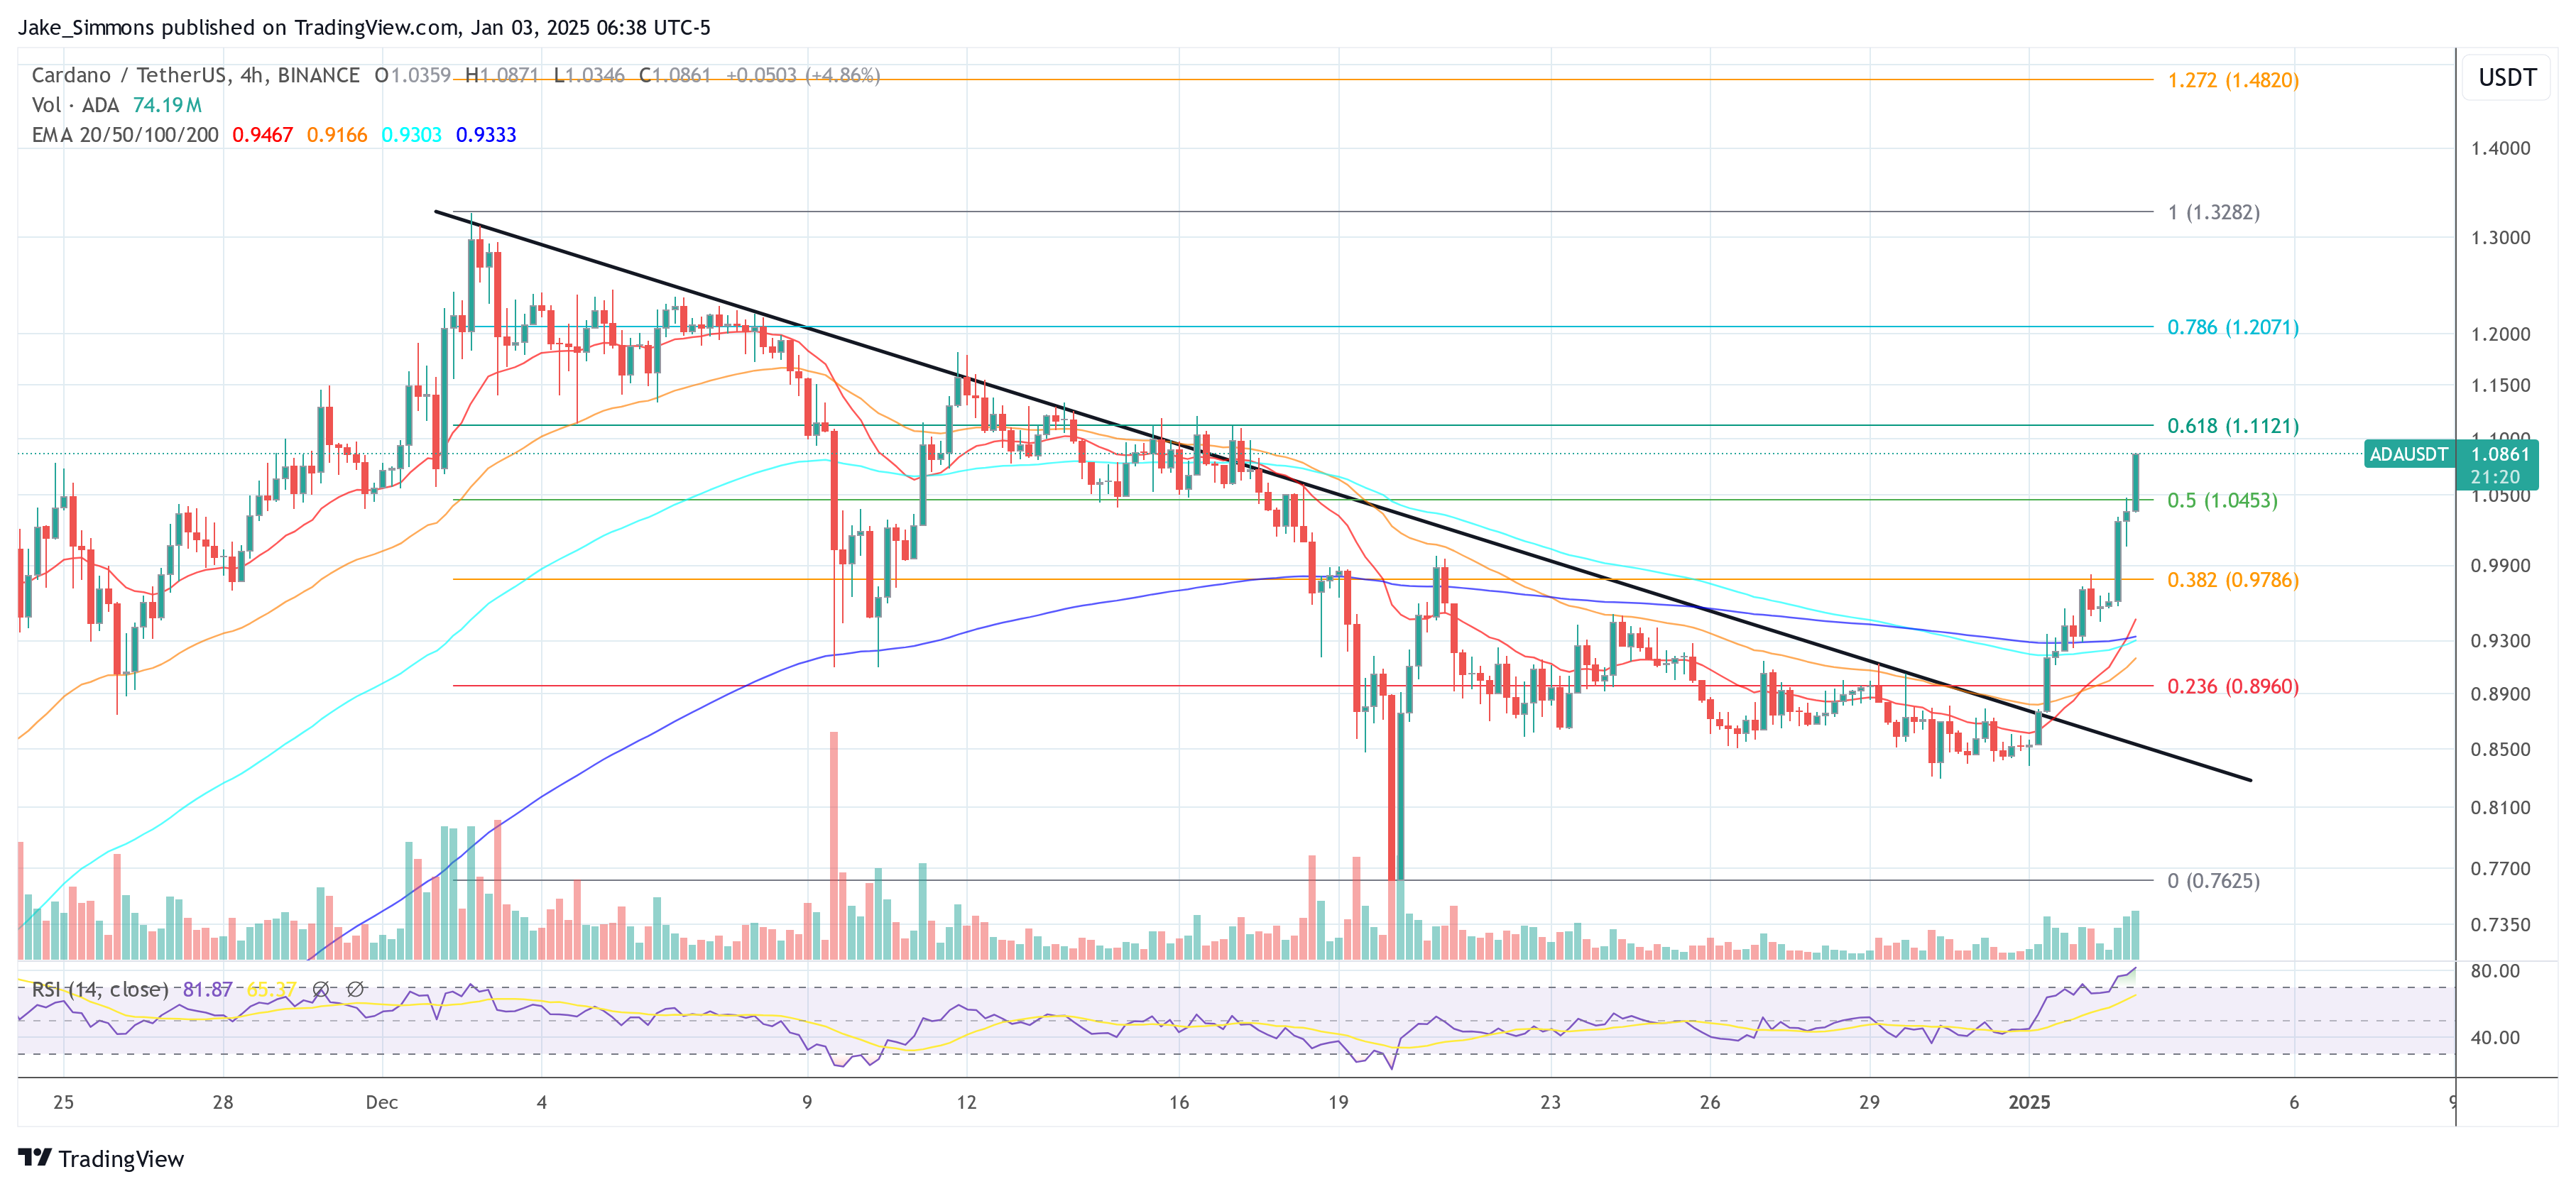
Fibonacci retracement levels anchored at the December 2 high and December 20 low indicate a positive technical setup. The 0.236 Fib at $0.89 acted as a support level after the trendline break, with the 0.382 Fib at $0.97 providing resistance initially but later giving way to further upside.
If bullish momentum continues, the 0.50 Fib at $1.04 could act as immediate support, with the 0.618 Fib at $1.11 as the next key hurdle. The 0.786 Fib at $1.20 and the 1.0 Fib at $1.3282 could come into play in the near-to-mid term if the rally persists.
Moving averages show that ADA has surpassed its 20, 50, 100, and 200 EMAs on the four-hour chart. The crossing of the 20 and 50 EMAs above the 100 and 200 EMAs indicates a shift in momentum in favor of the bulls. Additionally, the volume has increased by 14.94% to $1.67 billion in the last 24 hours, supporting the breakout scenario.
The RSI on the four-hour timeframe is around 80, indicating that ADA is in overbought territory. While this shows strong buying pressure, it also suggests a potential for a short-term pullback as traders may choose to take profits.
Featured image from Shutterstock, chart from TradingView.com