Ethereum is proving to be a stronghold in the volatile cryptocurrency market, maintaining its position above crucial levels while Bitcoin struggles to break its all-time highs. This stability in ETH’s price has sparked optimism among analysts, who are now anticipating a potential altcoin rally, with Ethereum leading the charge once it surpasses significant supply zones.
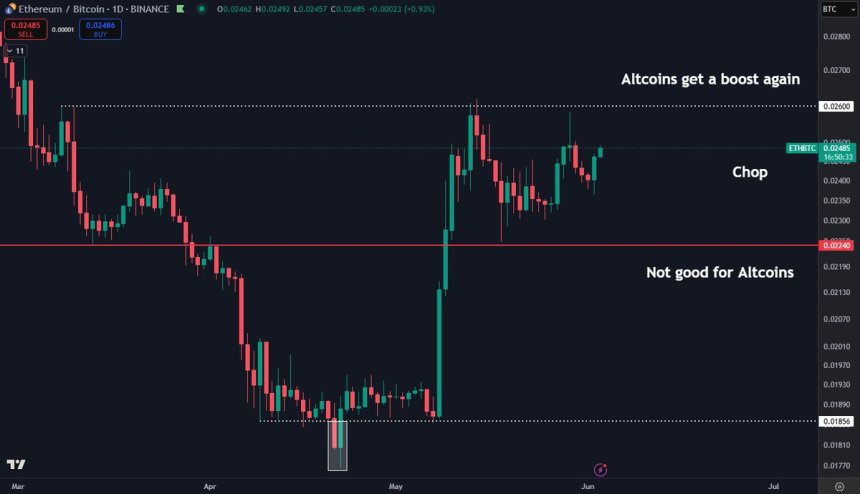
The focus has now shifted to an often overlooked yet highly influential chart—the ETHBTC pair. Renowned analyst Daan has pointed out that ETHBTC has been consolidating within a narrow range of 0.022 to 0.026 following a recent squeeze. This consolidation phase indicates a period of accumulation and reduced volatility, serving as a vital indicator for altcoin momentum.
If ETHBTC manages to break above the 0.026 resistance level, Daan believes it could trigger a robust rally in ALT/BTC pairs. Sectors closely associated with Ethereum, such as DeFi protocols, ETH-based memecoins, and Layer 2 ecosystems, are likely to benefit the most from such a move. Hence, investors are closely monitoring Ethereum’s performance relative to Bitcoin as it remains a reliable gauge of capital rotation within the crypto market.
The significance of the ETHBTC chart cannot be understated when assessing the outlook for the altseason. Ethereum’s current trading range is critical, with a breakout potentially leading to new highs and igniting the anticipated altcoin rally. Despite global uncertainties and macroeconomic challenges, Ethereum has shown resilience, with market bulls interpreting the current consolidation phase as a healthy pause before a potential upward trend.
Daan emphasizes that a drop below 0.0224 in the ETHBTC pair could signal weakness for altcoins compared to Bitcoin. It’s important to note that ALT/BTC pairs can decline even if altcoin prices in USD rise, especially during strong Bitcoin rallies. Therefore, Ethereum’s position within this range serves as a crucial indicator for predicting the broader crypto market’s future direction.
As Ethereum continues to trade near key resistance levels, hovering around $2,640, it is displaying signs of strength by maintaining levels above $2,500. The cryptocurrency is forming a consolidation pattern below the 200-day moving average at $2,676, a level that has repeatedly acted as a barrier to price movements in recent weeks.
Despite the lack of a definitive breakout, Ethereum’s bullish structure, characterized by higher lows and consistent volume support, remains intact. The 34-day EMA is trending upwards, providing dynamic support at $2,418 and reinforcing the short-term uptrend. A successful breach of the 200-day SMA and a move above $2,700 could pave the way for a broader rally, potentially propelling Ethereum towards the $3,000 mark and beyond.
In case of a downside movement, immediate support levels are expected near $2,500, followed by stronger demand zones around $2,350–$2,400 where the 50- and 100-day SMAs converge. While Ethereum demonstrates resilience, it awaits a significant catalyst to overcome the technical barriers hindering its upward momentum.
In conclusion, Ethereum’s performance against Bitcoin, as reflected in the ETHBTC pair, holds the key to predicting the altcoin market’s future trajectory. As the market dynamics continue to evolve, Ethereum’s stability and potential for growth make it a focal point for investors and analysts alike.

