

Polkadot Price Analysis: Will the Bulls Break Above $5.35 Resistance?
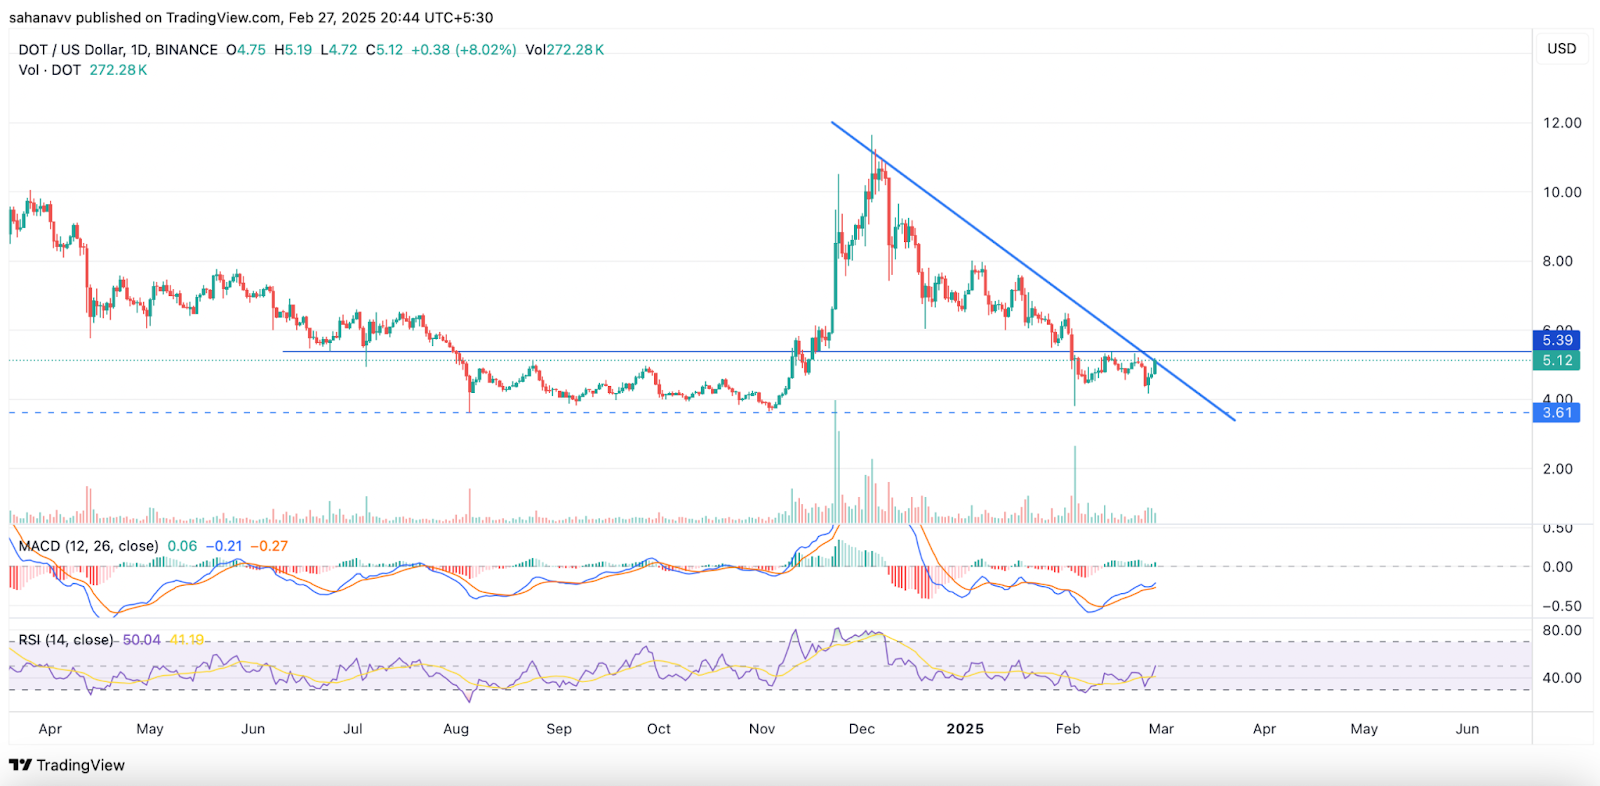
Polkadot price saw a remarkable 200% increase during the Q4 2024 rally, surging from lows of $3.61 to highs of $11.61. However, a subsequent pullback has kept the token under bearish pressure. Despite this, the platform has been experiencing a surge in liquidity since the beginning of the month, hinting at a potential major price movement on the horizon. The big question now is whether the bulls can push the price above the key resistance level at $5.35.
The year 2025 has been dubbed the year of ETFs, with more cryptocurrencies being added to the list. The latest addition is Polkadot, filed by Grayscale, which has sparked bullish sentiment among market participants for an upcoming DOT price rally. The trading volume, which had been declining, suddenly spiked, indicating heightened trader interest in the token. If the bulls can maintain momentum above crucial levels, the price could potentially reach $6.
Technical Analysis
Looking at the chart, we can see that the DOT price is currently testing a descending trend line that has been a strong resistance throughout the year. Additionally, the RSI has been consolidating within lower levels, while the MACD has remained in negative territory. However, there are signs of potential bullish momentum, with the MACD showing divergence from a bearish crossover and the RSI attempting to move above average levels.
If the bulls can break out above the resistance, the price may target the crucial level at $5.39. This breakout is essential to sustain bullish momentum; otherwise, the price could face rejection and remain range-bound. The rise in OBV & CMF indicators suggests increasing bullish strength and liquidity, indicating that Polkadot price is likely to continue on an upward trend and potentially surpass $6 in the near future.